
Operating deficit worsens for aged care providers: StewartBrown


The operating deficit for residential aged care operators in the September 2025 quarter was significantly lower than the FY25 result, according to StewartBrown's latest Aged Care Financial Performance Survey Report.
The survey of 1,205 aged care homes – or 47% of the sector – for the three months to 30 September 2025, found operators achieved an operating deficit of $7.14 per bed day (pbd).
The September quarter 2025 result was a “very disappointing” deterioration on the $3.08 pbd deficit recorded for the 2024-25 financial year, yet it was an improvement on the $8.45 deficit recorded by aged care operators in the September quarter the previous year.
Overall, 59% of homes made an operating loss for the September quarter.
Operating EBITDA averaged $5,486 per bed per annum (pbpa), an improvement on the $4,734 pbpa result achieved in the previous September quarter.
However, the result is still well short of the operating EBITDA of $20,000 – $22,000 pbpa StewartBrown has long advocated is required to make the sector “investable” – the equivalent of a 4% return on a $550,000 new build.
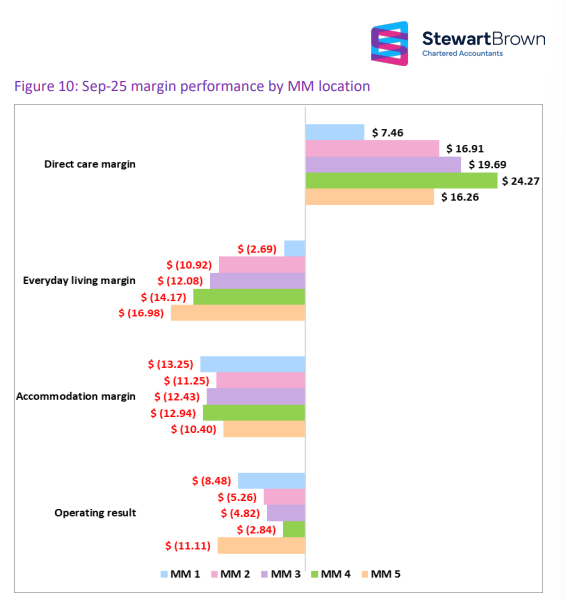
Direct care margins cover losses
Direct care margins continues to cross-subsidise Everyday Living and Accommodation losses.
The AN-ACC (direct care) margin decreased to $11.84 pbd, compared with $16.10 pbd in FY25. StewartBrown anticipates the margin will “further decline” as operators move closer to meeting their mandated care minute targets or receive a lower AN-ACC subsidy if they choose not to increase staff minutes.
The Everyday Living margin deficit of $6.16 pbd was a slight improvement on the FY25 result of a deficit of $7.13 pbd. The higher hotelling supplement from 20 September 2025 ($22.15 pbd) will improve the Everyday Living margin.
The Accommodation margin deficit ($12.82 pbd) has further declined (FY25: deficit of 12.05 pbd). The additional 2% pa RAD retention (for incoming residents payable over a maximum of 5 years) will improve the performance to a certain extent but “not nearly sufficient” to make a substantial improvement in the accommodation margin.
Other notable results:
- Occupancy increased to 94.9%, up from 93.8% at the same time a year prior.
- Compared with the September quarter in 2024, there was a slight decrease in agency usage and no change in overtime proportion for direct care minutes.
- Aged care homes located in MM1 (metropolitan areas) comprise more than 64% of all facilities in Australia. Historically, this cohort has delivered the strongest financial performance. However, as of September 2025, MM1 homes are performing below those in MM2 to MM4 – driven by a comparatively low direct care margin. The main reason for this margin differential is that MM1 homes receive no Basic Care Tariff loading within the AN-ACC funding whereas other MM categories do. The margins of MM1 homes may decline further in FY26 once the policy for adjusting the Care minute supplement comes into effect whereby homes that do not meet care minute targets in MM1 locations will not receive the full supplement.
- Larger providers with more than 20 facilities have the highest operating result and the highest adjusted operating result compared to other groups.
You can download the report in full here.


